Basic usage
[1]:
import gnt
import pandas as pd
Data
First, we load data from Najm et al. “Orthologous CRISPR–Cas9 enzymes for combinatorial genetic screens.” These data should be in the format: guide 1, guide 2, gene 1, gene 2, followed by different conditions that were screened.
[2]:
lfcs = pd.read_csv('https://raw.githubusercontent.com/PeterDeWeirdt/bigpapi/master/data/processed/bigpapi_lfcs.csv')
lfcs
[2]:
| U6 Sequence | H1 Sequence | U6 gene | H1 gene | Day 21_786O | Day 21_A375 | Day 21_A549 | Day 21_HT29 | Day 21_Meljuso | Day 21_OVCAR8 | |
|---|---|---|---|---|---|---|---|---|---|---|
| 0 | AAAGTGGAACTCAGGACATG | AAAAAAAGAGTCGAATGTTTT | HPRT intron | 6T | 0.421135 | 0.250043 | 0.725424 | 0.635972 | 0.127104 | 0.245427 |
| 1 | AAAGTGGAACTCAGGACATG | AAAGAGTCCACTCTGCACTTG | HPRT intron | UBC | 0.040784 | 0.125369 | 0.343278 | 0.524569 | -0.175984 | 0.371689 |
| 2 | AAAGTGGAACTCAGGACATG | AACAGCTCCGTGTACTGAGGC | HPRT intron | CD81 | 0.711486 | 0.857567 | 1.513217 | 0.970841 | 0.630948 | 0.675330 |
| 3 | AAAGTGGAACTCAGGACATG | AAGACGAAATTGAAGACGAAG | HPRT intron | CD81 | 0.451992 | 0.588394 | 1.283543 | 0.771713 | 0.409791 | 0.643640 |
| 4 | AAAGTGGAACTCAGGACATG | AAGCGTACTGCTCATCATCGT | HPRT intron | HSP90AA1 | 0.477678 | -0.652709 | 0.442170 | 0.021827 | 0.187209 | -0.120412 |
| ... | ... | ... | ... | ... | ... | ... | ... | ... | ... | ... |
| 9179 | TTCTGACTACAACATCCAGA | TTGCTTTCATTTAATGCTACA | UBB | PARP2 | -0.228266 | -0.371034 | -0.014272 | 0.570256 | -0.437522 | -0.717872 |
| 9180 | TTCTGACTACAACATCCAGA | TTGGGACGAGTCCTGTGAGAA | UBB | IMPDH1 | -0.178963 | -0.024237 | -0.323317 | 0.630812 | -0.421810 | 0.197531 |
| 9181 | TTCTGACTACAACATCCAGA | TTTAGGAATTGCTGTTGGGAC | UBB | HPRT intron | -0.266031 | -0.429865 | -0.145153 | 0.147415 | -0.454209 | -0.266580 |
| 9182 | TTCTGACTACAACATCCAGA | TTTCCATCACTTGGTTGAATA | UBB | BCL2A1 | -0.295739 | -0.221819 | -0.173578 | 0.231540 | -0.430689 | -0.377972 |
| 9183 | TTCTGACTACAACATCCAGA | TTTGCCTGTGAGGTGGCCGCC | UBB | CD81 | -0.001195 | 0.419874 | 0.815933 | 0.678013 | 0.211364 | -0.333385 |
9184 rows × 10 columns
Calculating residuals
From the log fold changes, we calculate residuals at the guide level. We reason that interactors for a given “anchor” guide deviates from the expected range of LFCs of its “target” pairs. We fit a linear model between the median LFC of targets paired with controls and the average LFC of constructs with both an anchor and target guide. Negative residuals from this line indicate a synthetic lethal relationship, whereas positive residuals represent a buffering interaction.
[3]:
guide_residuals, model_info = gnt.get_guide_residuals(lfcs, ['CD81', 'HPRT intron'])
guide_residuals.sort_values('residual_z')
[3]:
| anchor_guide | target_guide | anchor_gene | target_gene | condition | lfc | lfc_target | residual | residual_z | |
|---|---|---|---|---|---|---|---|---|---|
| 3822 | AAGCACCAGATCATGCACCG | TCGTGGGCACAAGGTCCTACA | MAP2K2 | MAP2K1 | Day 21_HT29 | -3.339721 | -1.462993 | -1.855250 | -7.024817 |
| 76126 | GGGTAGTTCTCTCTTCATGGA | TCATCAACAGAGCCCGCCAA | WEE1 | WEE1 | Day 21_HT29 | -5.676895 | -1.874498 | -2.627443 | -6.821507 |
| 70479 | GGCGATCTGGGGGAGGGGTGC | GCTGTCAGGAGTATTCTGAC | CD81 | CHEK1 | Day 21_HT29 | -5.731891 | -4.358044 | -1.587411 | -6.419596 |
| 2106 | AACAGCTCCGTGTACTGAGGC | TGGTATTGGAATAACTCACA | CD81 | CHEK1 | Day 21_HT29 | -5.921955 | -4.476059 | -1.468627 | -6.151146 |
| 49800 | GAAAGTATCTCGTTACTGGAA | TGGTATTGGAATAACTCACA | BRCA1 | CHEK1 | Day 21_HT29 | -5.573397 | -4.476059 | -1.366310 | -6.052855 |
| ... | ... | ... | ... | ... | ... | ... | ... | ... | ... |
| 68740 | GGATCACGCCTCCAGCCAGC | GATCACGCCTCCAGCCAGCTG | CD81 | CD81 | Day 21_HT29 | 2.950638 | 0.978768 | 1.750542 | 6.790943 |
| 57533 | GATCACGCCTCCAGCCAGCTG | GGATCACGCCTCCAGCCAGC | CD81 | CD81 | Day 21_786O | 3.943046 | 0.835260 | 2.536494 | 8.249168 |
| 68452 | GGATCACGCCTCCAGCCAGC | GATCACGCCTCCAGCCAGCTG | CD81 | CD81 | Day 21_786O | 3.943046 | 1.040996 | 2.460461 | 8.347438 |
| 68932 | GGATCACGCCTCCAGCCAGC | GATCACGCCTCCAGCCAGCTG | CD81 | CD81 | Day 21_OVCAR8 | 4.011292 | 1.315501 | 2.334258 | 8.510013 |
| 58013 | GATCACGCCTCCAGCCAGCTG | GGATCACGCCTCCAGCCAGC | CD81 | CD81 | Day 21_OVCAR8 | 4.011292 | 1.005960 | 2.393177 | 8.561875 |
110208 rows × 9 columns
Model info
We can also look at the fit of the linear model for each guide, by considering its R2. A low R2 can represent a phenotypically dominant guide.
[4]:
model_info.sort_values('R2')
[4]:
| model | R2 | f_pvalue | const | beta | anchor_guide | anchor_gene | condition | |
|---|---|---|---|---|---|---|---|---|
| 855 | linear | 0.148726 | 1.237419e-04 | -4.285076 | 0.358985 | GTTGTGCGCGTGCTCGAAGG | EEF2 | Day 21_HT29 |
| 1064 | linear | 0.157745 | 6.744733e-05 | -4.926558 | 0.501217 | TGGTGTGCAAGGCGGGCATCA | EEF2 | Day 21_A549 |
| 1059 | linear | 0.161153 | 5.042642e-05 | -4.805119 | 0.403164 | TGGTATTGGAATAACTCACA | CHEK1 | Day 21_HT29 |
| 1062 | linear | 0.246355 | 3.133113e-07 | -4.415317 | 0.388307 | TGGTGTGCAAGGCGGGCATCA | EEF2 | Day 21_786O |
| 1017 | linear | 0.277469 | 3.529957e-08 | -3.829045 | 0.540500 | TGCCAACCTCCGACAAAGGT | EEF2 | Day 21_HT29 |
| ... | ... | ... | ... | ... | ... | ... | ... | ... |
| 406 | linear | 0.991998 | 2.324465e-100 | 0.294490 | 1.003528 | CCTGCACTCGGAGAAGAACG | AKT1 | Day 21_Meljuso |
| 347 | linear | 0.992036 | 2.092961e-99 | -0.003417 | 1.037822 | CCAGGAATCCCAGTGCCTGC | CD81 | Day 21_OVCAR8 |
| 403 | linear | 0.992262 | 4.794280e-101 | 0.101981 | 0.998951 | CCTGCACTCGGAGAAGAACG | AKT1 | Day 21_A375 |
| 430 | linear | 0.992594 | 6.112498e-102 | -0.017872 | 1.011639 | CGCCAACAACGCCAAGGCTG | CD81 | Day 21_Meljuso |
| 745 | linear | 0.993189 | 1.191829e-103 | -0.013714 | 0.995770 | GGGAAGGACAGGTCTAACAG | HPRT intron | Day 21_A375 |
1152 rows × 8 columns
Combining scores at the gene level
We then combine the residual for a gene pair by taking the z-score
\((\bar x - \mu)/(\sigma / \sqrt{n})\)
Where \(\bar x\), \(\mu\), \(\sigma\) are the sample mean, population mean, and population standard deviation of residuals, and \(n\) is the number of guide pairs.
[5]:
gene_scores = gnt.get_gene_residuals(guide_residuals, 'residual_z')
gene_scores.sort_values('pair_z_score')
[5]:
| condition | gene_a | gene_b | lfc | base_lfc_a | base_lfc_b | guide_pairs | pair_z_score_gene_a_anchor | pair_z_score_gene_b_anchor | pair_z_score | |
|---|---|---|---|---|---|---|---|---|---|---|
| 1556 | Day 21_HT29 | MAPK1 | MAPK3 | -1.754885 | -0.272907 | 0.279881 | 18 | -12.525889 | -12.505035 | -17.699536 |
| 2426 | Day 21_OVCAR8 | MAPK1 | MAPK3 | -0.616311 | 0.171391 | 0.511401 | 18 | -12.116484 | -11.518992 | -16.712805 |
| 1991 | Day 21_Meljuso | MAPK1 | MAPK3 | -1.194016 | -0.318689 | 0.575274 | 18 | -9.259513 | -12.882693 | -15.656904 |
| 1121 | Day 21_A549 | MAPK1 | MAPK3 | -1.291028 | 0.565824 | 0.293042 | 18 | -10.960474 | -9.671142 | -14.588755 |
| 1999 | Day 21_Meljuso | BCL2L1 | MCL1 | -2.643591 | -1.173048 | -0.004209 | 18 | -8.671315 | -11.529244 | -14.283952 |
| ... | ... | ... | ... | ... | ... | ... | ... | ... | ... | ... |
| 462 | Day 21_A375 | BCL2L1 | BCL2L1 | -0.544783 | 0.092347 | 0.092347 | 9 | 10.978989 | 10.978989 | 15.526634 |
| 2015 | Day 21_Meljuso | MCL1 | MCL1 | -0.561327 | -0.004209 | -0.004209 | 9 | 11.730678 | 11.730678 | 16.589684 |
| 1494 | Day 21_HT29 | MAP2K1 | MAP2K1 | -1.443300 | -0.864259 | -0.864259 | 8 | 12.365253 | 12.365253 | 17.487108 |
| 1767 | Day 21_Meljuso | BCL2L1 | BCL2L1 | -2.519740 | -1.173048 | -1.173048 | 9 | 12.901715 | 12.901715 | 18.245780 |
| 275 | Day 21_786O | MCL1 | MCL1 | 0.054351 | 0.031233 | 0.031233 | 9 | 13.223069 | 13.223069 | 18.700243 |
2610 rows × 10 columns
Other models: spline, fixed slope and quadratic
There are options to implement different models for calculating residuals at the guide level, including spline, fixed slope and quadratic
[6]:
spline_residuals, spline_model_info = gnt.get_guide_residuals(lfcs, ['CD81', 'HPRT intron'], model='spline')
[7]:
spline_residuals.sort_values('residual_z')
[7]:
| anchor_guide | target_guide | anchor_gene | target_gene | condition | lfc | lfc_target | residual | residual_z | |
|---|---|---|---|---|---|---|---|---|---|
| 3822 | AAGCACCAGATCATGCACCG | TCGTGGGCACAAGGTCCTACA | MAP2K2 | MAP2K1 | Day 21_HT29 | -3.339721 | -1.462993 | -1.863573 | -7.072779 |
| 76126 | GGGTAGTTCTCTCTTCATGGA | TCATCAACAGAGCCCGCCAA | WEE1 | WEE1 | Day 21_HT29 | -5.676895 | -1.874498 | -2.429127 | -6.594250 |
| 3726 | AAGCACCAGATCATGCACCG | TCGTGGGCACAAGGTCCTACA | MAP2K2 | MAP2K1 | Day 21_A549 | -2.394606 | -0.333970 | -2.073076 | -5.994032 |
| 70479 | GGCGATCTGGGGGAGGGGTGC | GCTGTCAGGAGTATTCTGAC | CD81 | CHEK1 | Day 21_HT29 | -5.731891 | -4.358044 | -1.456496 | -5.989739 |
| 6639 | ACACCACCTGAAGTGACTCG | CACAGGTCTTTCCTTATGGGA | CHEK1 | CHEK1 | Day 21_HT29 | -3.539920 | -0.914817 | -1.715034 | -5.936140 |
| ... | ... | ... | ... | ... | ... | ... | ... | ... | ... |
| 68740 | GGATCACGCCTCCAGCCAGC | GATCACGCCTCCAGCCAGCTG | CD81 | CD81 | Day 21_HT29 | 2.950638 | 0.978768 | 1.714901 | 6.907205 |
| 68932 | GGATCACGCCTCCAGCCAGC | GATCACGCCTCCAGCCAGCTG | CD81 | CD81 | Day 21_OVCAR8 | 4.011292 | 1.315501 | 2.082427 | 7.943309 |
| 57533 | GATCACGCCTCCAGCCAGCTG | GGATCACGCCTCCAGCCAGC | CD81 | CD81 | Day 21_786O | 3.943046 | 0.835260 | 2.403812 | 8.161444 |
| 68452 | GGATCACGCCTCCAGCCAGC | GATCACGCCTCCAGCCAGCTG | CD81 | CD81 | Day 21_786O | 3.943046 | 1.040996 | 2.412874 | 8.223310 |
| 58013 | GATCACGCCTCCAGCCAGCTG | GGATCACGCCTCCAGCCAGC | CD81 | CD81 | Day 21_OVCAR8 | 4.011292 | 1.005960 | 2.331811 | 8.407050 |
110208 rows × 9 columns
[8]:
spline_gene_scores = gnt.get_gene_residuals(spline_residuals, 'residual_z')
spline_gene_scores.sort_values('pair_z_score')
[8]:
| condition | gene_a | gene_b | lfc | base_lfc_a | base_lfc_b | guide_pairs | pair_z_score_gene_a_anchor | pair_z_score_gene_b_anchor | pair_z_score | |
|---|---|---|---|---|---|---|---|---|---|---|
| 1556 | Day 21_HT29 | MAPK1 | MAPK3 | -1.754885 | -0.272907 | 0.279881 | 18 | -12.806409 | -11.354713 | -17.084493 |
| 2426 | Day 21_OVCAR8 | MAPK1 | MAPK3 | -0.616311 | 0.171391 | 0.511401 | 18 | -12.012608 | -11.788136 | -16.829668 |
| 1991 | Day 21_Meljuso | MAPK1 | MAPK3 | -1.194016 | -0.318689 | 0.575274 | 18 | -9.445925 | -12.361523 | -15.420194 |
| 1121 | Day 21_A549 | MAPK1 | MAPK3 | -1.291028 | 0.565824 | 0.293042 | 18 | -10.916840 | -9.657316 | -14.548126 |
| 1739 | Day 21_HT29 | WEE1 | WEE1 | -2.240272 | -0.363547 | -0.363547 | 8 | -9.741398 | -9.741398 | -13.776417 |
| ... | ... | ... | ... | ... | ... | ... | ... | ... | ... | ... |
| 2450 | Day 21_OVCAR8 | MCL1 | MCL1 | 0.318145 | 0.345607 | 0.345607 | 9 | 11.242772 | 11.242772 | 15.899681 |
| 462 | Day 21_A375 | BCL2L1 | BCL2L1 | -0.544783 | 0.092347 | 0.092347 | 9 | 12.121925 | 12.121925 | 17.142990 |
| 2015 | Day 21_Meljuso | MCL1 | MCL1 | -0.561327 | -0.004209 | -0.004209 | 9 | 12.724680 | 12.724680 | 17.995415 |
| 275 | Day 21_786O | MCL1 | MCL1 | 0.054351 | 0.031233 | 0.031233 | 9 | 13.243036 | 13.243036 | 18.728482 |
| 1767 | Day 21_Meljuso | BCL2L1 | BCL2L1 | -2.519740 | -1.173048 | -1.173048 | 9 | 14.375425 | 14.375425 | 20.329920 |
2610 rows × 10 columns
[9]:
merged_predictions = spline_gene_scores.merge(gene_scores, how = 'inner', on = ['condition' ,'gene_a', 'gene_b'], suffixes=['_spline', '_linear'])
[10]:
merged_predictions.plot.scatter('pair_z_score_spline', 'pair_z_score_linear', alpha=0.4)
[10]:
<matplotlib.axes._subplots.AxesSubplot at 0x7fd9bd68e370>
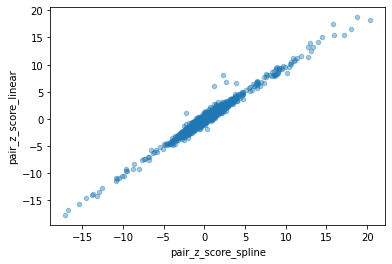
The spline fit does not give as much weight to essential gene EEF2, suggesting it can avoid this source of bias
[12]:
merged_predictions['difference'] = merged_predictions['pair_z_score_linear'] - merged_predictions['pair_z_score_spline']
merged_predictions.sort_values('difference').tail(5)
[12]:
| condition | gene_a | gene_b | lfc_spline | base_lfc_a_spline | base_lfc_b_spline | guide_pairs_spline | pair_z_score_gene_a_anchor_spline | pair_z_score_gene_b_anchor_spline | pair_z_score_spline | lfc_linear | base_lfc_a_linear | base_lfc_b_linear | guide_pairs_linear | pair_z_score_gene_a_anchor_linear | pair_z_score_gene_b_anchor_linear | pair_z_score_linear | difference | |
|---|---|---|---|---|---|---|---|---|---|---|---|---|---|---|---|---|---|---|
| 989 | Day 21_A549 | EEF2 | EEF2 | -4.524111 | -2.250681 | -2.250681 | 9 | 2.729341 | 2.729341 | 3.859871 | -4.524111 | -2.250681 | -2.250681 | 9 | 4.711166 | 4.711166 | 6.662595 | 2.802724 |
| 554 | Day 21_A375 | EEF2 | EEF2 | -4.689237 | -1.987910 | -1.987910 | 9 | -1.620841 | -1.620841 | -2.292216 | -4.689237 | -1.987910 | -1.987910 | 9 | 0.819324 | 0.819324 | 1.158700 | 3.450915 |
| 2294 | Day 21_OVCAR8 | EEF2 | EEF2 | -4.712816 | -2.330618 | -2.330618 | 9 | 1.902640 | 1.902640 | 2.690739 | -4.712816 | -2.330618 | -2.330618 | 9 | 4.855800 | 4.855800 | 6.867139 | 4.176399 |
| 1859 | Day 21_Meljuso | EEF2 | EEF2 | -4.994169 | -2.360364 | -2.360364 | 9 | 0.870522 | 0.870522 | 1.231104 | -4.994169 | -2.360364 | -2.360364 | 9 | 4.250344 | 4.250344 | 6.010894 | 4.779790 |
| 27 | Day 21_786O | BCL2L1 | BCL2L1 | -4.341688 | -2.433808 | -2.433808 | 9 | 1.640050 | 1.640050 | 2.319381 | -4.341688 | -2.433808 | -2.433808 | 9 | 5.684257 | 5.684257 | 8.038754 | 5.719373 |
[ ]: